

Background: Cancer treatment often imposes a substantial financial burden on patients, commonly described as financial toxicity. This financial burden and the complexity of anticancer medications may increase the risk of Drug-Related Problems (DRPs) and negatively affect the patient's Quality of Life (QoL). Improving patient-centered oncology care requires evaluating these factors.
Objectives: The purpose of this study was to use standardized assessment tools to evaluate financial toxicity, identify drug-related issues, and investigate how they relate to quality of life among cancer patients.
Materials and Methods: Prospective observational research was conducted over six months in the oncology department of a tertiary care teaching hospital. Consecutive sampling was used to recruit 150 adult cancer patients undergoing chemotherapy, targeted therapy, or supportive care. Financial toxicity was measured using the Comprehensive Score for Financial Toxicity (COST-FACIT) questionnaire, while health-related quality of life was measured using the Functional Assessment of Cancer Therapy-General (FACT-G) scale. Drug-related problems were categorized and identified using the Pharmaceutical Care Network Europe (PCNE) categorization version 9.1. The statistical analysis included descriptive statistics, the chi-square test, the independent sample t-test, correlation analysis, and multivariable linear regression.
Results: Among the participants, 50.7% experienced moderate financial toxicity and 35.3% reported mild financial toxicity. Most patients (62.7%) had a moderate level of quality of life, whereas 23.3% reported Low QoL. Drug-related problems were identified in 46.6% of patients, with prolonged treatment duration and inadequate outcome monitoring being the most frequent causes. Financial toxicity showed a weak negative correlation with QoL (r = -0.16, p=0.04). Nevertheless, a lower quality of life was not independently predicted by the presence of DRPs.
Conclusion: Financial toxicity is a common experience for cancer patients, and it is related to a lower quality of life. Although DRPs were frequently identified, their direct impact on QoL was limited in this study population. Early detection of financial burden and active involvement of clinical pharmacists may help improve treatment outcomes and reduce patient hardship.
Abstract
Share on Mobile
Scan to access on mobile
Keywords
Cancer patients
Clinical pharmacy
COST-FACIT
Drug-related problems
Financial toxicity
Oncology
PCNE classification
Pharmaceutical care
Quality of Life
INTRODUCTION
Cancer continues to be one of the most immediate global health issues of the 21st century, both in terms of its disease burden (morbidity and mortality) and its socioeconomic impact. Cancer mortality and incidence are growing quickly on a global scale. According to the World Health Organization (WHO), aging populations, population growth, and ongoing exposure to risk factors like alcohol, tobacco, obesity, and environmental pollutants are predicted to result in an increase in the number of new cancer cases from about 20 million per year to over 35 million by 2050. This rising burden is felt unevenly across regions, with the Low-and Middle-Income Countries (LMICs) expected to experience the highest proportional increase in both incidence and deaths due to limited access to early detection and adequate treatment services (Kitaw et al., 2025).
The economic impact of cancer on people, families, and healthcare systems is assessed along with incidence and mortality rates. Approximately 10 million mortality rates (one in six deaths) worldwide were attributable to cancer in 2020. Long-term economic growth, productivity, and national medical expenses are all severely impacted by the deaths and the related illness burden. Decision-analytical modelling study suggests that between 2020 and 2050, the economic cost of cancer care across the countries could reach a staggering $25.2 trillion (in international dollars), highlighting the massive economic strain that cancer imposes at a global level (Chen et al., 2023). One of the main causes of this financial burden is rising treatment prices. Multimodal treatment techniques, such as surgery, radiation, chemotherapy, targeted therapy, and immunotherapy, are commonly used in cancer care. Even while many of the most recent targeted and immunotherapeutic medications have better clinical results for some types of cancer, they are truly expensive. Regardless of whether they have health insurance or not, individuals are progressively facing a greater portion of the expenses through deductibles, copayments, and coinsurance, which leads to significant increases in overall expenditures (Tran and Zafar, 2018).
The problem of "financial toxicity"-the financial hardships resulting from cancer treatment costs-has been recognized in the medical literature as a side effect of therapy that is similar to physical toxicities. Both quantifiable economic stress (like high out-of-pocket expenses and lower income) and subjective psychological pain are components of financial toxicity, which varies widely throughout healthcare systems. Studies show that even in countries with public healthcare, an important proportion of cancer patients suffer from financial toxicity; prevalence estimates in some populations can approach 50-80%. Lower income, younger age, inadequate or non-existent insurance, and large out-of-pocket expenses all significantly raise the risk of financial toxicity (Sideris et al., 2025). Beyond only financial difficulty, financial toxicity causes patients to cut back on pharmaceutical use and postpone or stop therapy, which has a detrimental impact on clinical results. It is strongly associated with lower health-related quality of life as well as higher levels of anxiety, depression, and psychological stress in both patients and caregivers (Smith et al., 2019).
In addition to economic distress, drug-related problems are a major concern in cancer care that can further compromise quality of life. Drug-drug interactions, improper dosage, adverse drug responses, medication mistakes, and problems with the intricacy of chemotherapy and supportive care regimens are examples of DRPs. Cancer patients are often prescribed multiple agents including cytotoxic drugs, targeted therapies, antiemetics, pain medications, and agents to address comorbid conditions raising the risk of DRPs. Research indicates that many cancer patients experience clinically significant ADRs that require hospital stays, dose modifications, or discontinuation of therapy, all of which can reduce treatment effectiveness and increase healthcare costs (Osoro et al., 2026).
Financial toxicity and Drug-Related Problems (DRPs) significantly impair quality of life by affecting basic needs, increasing symptom burden, and causing emotional distress. These challenges can impair daily functioning, treatment satisfaction, medication adherence, and patients' ability to cope with the disease, highlighting the close interaction between economic and clinical factors in cancer care (Lin et al., 2025). Due to high out-of-pocket medical expenses and inadequate health insurance coverage, cancer patients in India are particularly vulnerable to financial toxicity, which may negatively affect treatment compliance and quality of life (Smith et al., 2019).
Health Organization (WHO), aging
AIM
To evaluate the financial toxicity, drug-related problems, and their impact on health-related-quality of life among cancer patient's using validated assessment tools.
OBJECTIVES
• To examine the financial toxicity of cancer patients by using the COST-FACIT questionnaire.
• To evaluate HRQoL of the cancer patients by using the FACT-G scale.
• To identify and classify cancer patients using the DRP by the PCNE classification system.
• To determine the relationship between cancer patient's HRQoL and financial toxicity.
• To examine the relationship between DRPs and HRQoL.
• To explore the overall impact of the financial toxicity score on baseline patient characteristics.
METHODOLOGY
A prospective observational study was carried out in the oncology department of a teaching tertiary care hospital to assess financial toxicity, health-related quality of life, and drug-related issues among cancer patients using validated instruments like the PCNE classification, FACT-G Questionnaire, and FACIT-COST Questionnaire. Six months were spent doing this investigation (July 2024 to December 2024).
Based on their availability over the research period, 170 cancer patients in total were recruited by consecutive sampling. Adults aged ≥18 years diagnosed with any type of cancer receiving chemotherapy, targeted therapy, or supportive treatment and who provided written informed consent were included. Patients younger than 18 years, those with severe cognitive impairment or psychiatric illness, terminally ill individuals unable to complete the questionnaires, and those unwilling to participate were excluded.
Data Collection
Patient interviews, medical record review, and structured questionnaires were used to collect data. Demographic details, clinical characteristics, treatment regimens, and medication profiles were documented using a predesigned electronic data collection form designed based on financial toxicity-related past published questionnaires (Gordon et al., 2017 , Joshi et al., 2022). Patients were interviewed during hospital visits or admissions to ensure accurate information. Eastern Cooperative Oncology Group classification (ECOG) was used to report performance status (Sok et al., 2019).
COST-FACIT Questionnaire
The validated 12-item FACIT-COST (Functional Assessment of Chronic Illness Therapy-Comprehensive Score for Financial Toxicity) Version 2 was created by (De Souza et al., 2014 , 2017) to measure financial hardship related to cancer treatment. Each question is graded on a 5-point Likert scale from 0(not at all) to 4(very much). Because items 2, 3, 4, 5, 8, 9, and 10 are reverse-scored, higher total scores (0-44) imply less financial toxicity and more financial well-being. According to D' Rummo et al.'s grading scheme, a score of ≥26 denotes no toxicity (Grade 0), a score of 14-25 denotes mild financial toxicity (Grade 1), a score of 1-13 denotes moderate financial toxicity (Grade 2), and a score of 0 denotes severe financial toxicity (Grade 3). In oncology, this instrument is frequently used to evaluate therapeutic costs and their impact on treatment compliance, quality of life, and the need for financial assistance.
FACT-G Questionnaire
The Functional Assessment of Cancer Therapy-General (FACT-G) Version 4 is a validated instrument for assessing health-related quality of life in cancer patients. Its 27 components are divided into four categories: physical, social/family, emotional, and functional well-being. A 5-point Likert scale (0-4) is used to rate each item, with higher scores denoting a greater quality of life. For a more thorough assessment, cancer-specific subscales can be added to the overall score, which ranges from 0 to 108. The scores were divided into three groups: high (≥ mean + 1 SD), moderate (between mean ± 1 SD), and low (≤ mean -1 SD) (Parás-Bravo et al., 2017). In clinical and research contexts, the FACT-G is often used to assess therapy results and patient well-being (Cella et al., 1995; Overcash et al., 2001).
PCNE Classification System
Drug-Related Problems (DRPs) can be systematically identified and classified by using the validated PCNE classification version 9.1 framework. It was used as a framework in this study, with minor adaptations in wording for clarity and contextual relevance. These modifications do not affect the overall structure or intent of the original classification; however, the version used should be considered an adapted form rather than the official PCNE V9.1. ), and Outcome/status (O0-O3), each with defined subdomains. A problem refers to an actual or potential issue in drug therapy, while a cause denotes the action or omission leading to that issue. Although a single problem may involve multiple causes and interventions, it results in one final status. PCNE V9.1 is widely used in clinical and pharmacy practice to document DRPs, enhance medication safety, and improve patient care (Ahmed et al., 2021).
It organizes DRPs into five main domains: Problems (P1-P3), Causes (C1-C9), Interventions (I0-I4), intervention Acceptance (A1-A3
Ethical Considerations
The Nirmala College of Pharmacy-Institutional Ethics Committee approved the study; the COST-FACIT and FACT-G questionnaires were used with permission from the respective copyright holders (https://www.facit.org); the PCNE classification system was used in compliance with published guidelines (drp@ pcne.org); and each participant provided written informed permission before any data collection.
Statistical Analysis
After the data was imported into Microsoft Excel, one statistical program utilized to evaluate it was IBM SPSS Statistics for Windows, Version 30.0.0.0 (172). Clinical and sociodemographic data were summarized using descriptive statistics. Multivariable linear regression analysis was employed to examine the association between baseline patient characteristics and COST ratings after adjusting for pertinent factors. The average difference in COST scores between patient groups and the reference category is shown by the regression coefficients. Factors associated with statistical significance in univariate analysis (p<0.10) and a few clinically significant demographic and clinical factors are included in the Multiple Linear Regression analysis.
Correlation analysis was used to assess the relationship between financial toxicity, DRPs, and quality of life. If the correlation coefficient was < 0.19, it was very weak; if it was between 0.20 and 0.39, it was weak; if it was between 0.40 and 0.59, it was considered moderate; if it was between 0.60 and 0.79, it was said to be strong; and if it was between 0.80 and 1.0, it was called very strong. A two-tailed p-value of less than 0.05 was considered statistically significant. The relationship between financial toxicity and QoL and the impact of QoL on the severity of DRPs was examined using the chi-square test. The FACT-G ratings of patients with and without Drug-Related Disorders (DRPs) were compared using an independent samples t-test.
RESULTS
A total of 170 patients were screened, 20 were excluded, and 150 patients were enrolled in the analysis. The 150 patients (88.2%) agreed to participate. 13 patients had comorbidities, and 7 patients did not provide informed consent; we excluded these 20 patients as per exclusion criteria. The Sociodemographic and Clinical Characteristics (categorical variables) among these 150 patients are shown in Table 1.
The mean age of research participants was approximately 47-48 years, indicating a slightly right-skewed distribution due to a larger proportion of older patients. This population's median age was 49.2 years (range >50); 57% of these patients were female (n=86), 87% were married (n=130), and 45% had completed primary education. Among the participants, 27% (n=41) were employed, and 27% (n=41) were homemakers. Most participants (69%, n=104) reported a household size of 2 -4 persons. In this study, 72% (n=108) had non-metastatic or localized disease, and 28% (n=42) had metastatic disease, of which 59% (n=89/108) were Stage-II and 22% (n=33/108) were Stage-III. Most of these patients had Gastrointestinal Cancers (n=30, 20%), followed by Gynaecological Cancers (n=18, 12%). According to ECOG performance status, 68% (n=102) of patients were classified as ≥ grade 2, followed by 17.3% (n=26) in grade 0, and 14.7% (n=22) in grade 1.
Descriptive of Financial Statistics and QoL
Among the study population (n=150), a substantial proportion of patients experienced financial toxicity during cancer treatment. Overall, 86% of patients reported a mild to moderate level of financial toxicity, with 50.7% (n=76) experiencing moderate financial toxicity and 35.3% (n=53) reporting mild financial toxicity, while only 14% (n=21) reported no financial impact were graded by the COST-FACIT Scoring Guidelines, as shown in Figure 1. No patients in this study reported major financial toxicity.
With respect to financial and employment-related characteristics, 58% of patients (n=87) did not have any form of health insurance, while only 42% (n=63) were insured. The majority of patients reported annual household incomes in the lower income brackets, with 34% (n=51) earning less than INR 1,25,000 per year and 60% (n=90) earning between INR 1,25,000 and 5,00,000 annually. Only a small proportion of patients reported annual incomes above INR 5,00,000. Employment disruption following cancer diagnosis was common, with 69% of patients (n=103) reporting a reduction in working hours and 14% (n=21) having stopped working altogether. In addition, treatment-related expenses were considerable, as 34% of patients (n=34) reported per-visit treatment costs below INR 25,000, whereas 46.7% (n=70) incurred costs between INR 25,000 and 50,000, and 20.7% (n=46) reported expenses exceeding INR 50,000 per visit. These results demonstrate the significant financial burden that cancer patients bear and provide an explanation for the elevated prevalence of financial toxicity found in the study. Among patients with financial burden (n=129), the most common cost-coping strategies were borrowing money at interest (31%, n=40) and borrowing from relatives or friends (19.3%, n=25). The detailed Assessment of cost-coping strategies for patients is provided in Supplementary Table S1.
A moderate quality of life was reported by 62.7% (n=94) of the patients, a low quality of life by 23.3% (n=35), and a high quality of life by 14% (n=21), as shown in Figure 2.
Drug-Related Problems (DRPs)
Out of 150 patient files, 70 patients (46.6%) with drug-related problems were involved in this study of PCNE Classification. The median age of this study population was above 50 yrs in which 57.1% of them being above 50 years. Most of them were females, 47 (67.1%). The majority of the patients were taking more than 5 medications. The percentages of Drugs or Drug groups which were cause DRPs in the study are shown in Table 2.
Upon analysis, the two most common causes of DRPs were 25.7% of Duration of treatment too long and 14.2% of Inadequate or improper outcome monitoring (including TDM), as shown in the Table 3.
Relation between Variables and Financial Toxicity
The COST score-based univariate and multivariable evaluations of baseline patient characteristics associated with financial toxicity are presented in 4. In the univariate analysis, the patients with health insurance reported significantly higher COST scores compared with uninsured patients (coefficient 4.08, 95%CI: 1.3 to 6.8; p=0.004). Low annual income (< INR 1,25,000) was associated with high financial toxicity, reflected by lower COST scores (coefficient-3.13, 95% CI:-6.0 to-0.2; p=0.035). Furthermore, COST scores were significantly reduced for patients who reported no change in work status compared with those who reported a reduction in working hours or stopped working (coefficient =-4.37, 95% CI:-8.0 to-0.7; p=0.018). In this univariate analysis, no statistically significant correlations were observed for gender, age, level of education, marriage status, number of people in the household, employment, or ECOG performance status (all p>0.05).
Upon the multi-variable model's adjustment for possible confounders, low-income status remained a significant predictor of increased financial toxicity. The COST scores of patients' incomes less than INR 1,25,000 per year were lower than those of patients earning more than INR 3 million (coefficient=-9.44, 95% CI:-16.2 to-2.6; p=0.006). Similarly, individuals earning between INR 1,25,000 and 5,00,000 also demonstrated increased financial toxicity (coefficient=4.07, 95% CI: 0.5 to 7.5; p=0.022). Furthermore, patients living in households with 1-2 members showed significantly higher COST scores compared with households comprising more than six members (coefficient 9.50, 95% CI: 0.4 to 18.5; p=0.039). Other clinical and demographic factors, such as age, gender, marital status, level of education,
occupation, changes in employment, insurance status, & ECOG performance status, did not significantly correlate with financial toxicity, according to the multi-variable analysis (all p>0.05).
Variance Inflation Factors (VIF) were used to evaluate multicollinearity for all predictor variables, including dummy-coded education categories, demonstrating VIF values below 2, indicating no evidence of multicollinearity.
Relation between Financial Toxicity and QoL
Financial toxicity and Quality-of-Life (QoL) has a weak negative correlation, as indicated by the Pearson correlation coefficient (r) of -0.16 (p=0.04) between the COST score and the FACT-G score.
The correlation indicates a weak association between a decline in QoL (lower FACT-G scores) and higher financial toxicity (lower COST scores).
Impact of Financial Toxicity on Quality of Life
The association between the impacts of financial toxicity and quality-of-life was examined by using the Chi-square test of independence. χ² (4, n=150)=58.6, p<0.001, showed a statistically significant correlation (QoL declines as financial toxicity impact grows).
DRPs Effect on the Level of QoL
Patients with and without DRPs were compared using an independent t-test. A statistically significant difference in FACT-G scores was observed between patients with and without DRPs (p<0.001). However, the higher mean score in the DRP group suggests that the presence of DRPs did not result in a clinically meaningful reduction in quality of life within this study population.
Table 1 The research population's clinical and sociodemographic characteristics (n=150) and Eastern Cooperative Oncology Group Performance Status.
| Characteristic | Frequency (%) | Health Insurance Status | |
|---|---|---|---|
| Age Group (Years) | Yes | 63 (42) | |
| LT 20 | 0 (0) | No | 87 (58) |
| 20 - 25 | 3 (2) | Current Employment Changes | |
| 26 - 30 | 5 (3) | Stopped Working | 21 (14) |
| 31 - 35 | 11 (7) | Reduction in working hours | 103 (69) |
| 36 - 40 | 7 (5) | No change in work | 26 (17) |
| 41 - 45 | 29 (19) | Increased working hours | 0(0) |
| 46 - 50 | 28 (19) | Annual Household Income- INR | |
| GT 50 | 67 (45) | <1,25,000 | 51 (34) |
| Gender | 1,25,000-5,00,000 | 90 (60) | |
| Male | 64 (43) | 5,00,000- 3 million | 9 (6) |
| Female | 86 (57) | 3 million | 0 (0) |
| Type of Marital Status | Type of Primary Cancer Site | ||
| Unmarried | 6 (4) | Carcinomas | 17 (11) |
| Married | 130 (87) | Sarcomas | 6 (4) |
| Divorced/Separated/Widowed | 11 (7) | Leukaemia’s | 13 (9) |
| Widower | 3 (2) | Lymphomas | 9 (6) |
| Type of Education Level | Myelomas | 1 (1) | |
| No Education | 42 (28) | CNS Cancers | 7 (5) |
| Primary level | 67 (45) | Skin Cancers | 2 (1) |
| Secondary level | 30 (20) | Head and neck cancers | 17 (11) |
| Graduate | 10 (7) | Thoracic cancers | 13 (9) |
| Postgraduate and above | 1 (1) | Gastrointestinal cancers | 30 (20) |
| Type of Occupation | Genitourinary Cancers | 10 (7) | |
| Unemployed | 9 (6) | Gynaecologic Cancers | 18 (12) |
| Employed | 41 (27) | Endocrine Cancers | 5 (3) |
| Labour work | 31 (21) | Rare and Other Cancers | 2 (1) |
| Homemaker | 41 (27) | Cancer stage for Localized Disease | |
| Farmer | 19 (13) | Stage 0 | 0 (0) |
| Business | 9 (6) | Stage- I | 20 (13) |
| Household Size (Persons) | Stage- II | 89 (59) | |
| 1-2 | 10 (7) | Stage- III | 33 (22) |
| 2-4 | 104 (69) | Stage- IV | 8 (5) |
| 4-6 | 29 (19) | Approximate treatment amount (for each visit)- INRa) | |
| > 6 | 7 (5) | <25000 | 34 (23) |
| Disease Extent | 25000 - 50000 | 70 (47) | |
| Metastatic | 42 (28) | 50000 - 100000 | 15 (10) |
| Non-metastatic | 108 (72) | >100000 | 31 (21) |
| ECOGb)- Status of Performance | |||
| Score | Frequency (%) | ||
| 0 | 26 (17.3) | ||
| 1 | 22 (14.7) | ||
| ≥2 | 102 (68.0) | ||
| a) INR, Indian Rupees; b) Eastern Cooperative Oncology Group. | |||
Table 2 Demographics and Clinical Data, Drug Group/Drug(n=70).
| Age | Frequency (%) | Drug Group/Drug | Frequency (%) |
|---|---|---|---|
| 21 - 30 | 5 (7.1) | Opioid | 2 (2.8) |
| 31 - 40 | 10 (14.2) | Calcium Channel Blocker | 1 (1.4) |
| 41 - 50 | 15 (21.4) | Lactulose | 12 (17.1) |
| Above 50 | 40 (57.1) | Furosemide | 5 (7.1) |
| Gender | Paracetamol | 15 (21.4) | |
| M | 23 (32.8) | Pantoprazole | 18 (25.7) |
| F | 47 (67.1) | Levetiracetam | 3 (4.2) |
| No. of Medications | Ondansetron | 10 (14.2) | |
| ≤ 5 | 15 (21.4) | Enoxaparin | 2 (2.8) |
| > 5 | 55 (78.5) | Antibiotics | 4 (5.7) |
Table 3 Classification of Drug- related problems according to the PCNE Classification V 9.1.
| Drug-Related-Problems Classification (DRP) | Frequency (%) |
|---|---|
| Potential or Manifest Problems (n=70) | |
| P1.1- Drug treatment has no effect even when used properly | 0 (0) |
| P1.2- No optimal Drug therapy's effects | 25 (35.7) |
| P1.3- Untreated signs or symptoms | 5 (7.1) |
| P2.1- Adverse drug events occurred | 20 (28.5) |
| P3.1- Drug treatment that is not necessary | 20 (28.5) |
| P3.2- Uncertain complaint/problem | 0 (0) |
| Causes of the DRP (n=70) | |
| C1.1- Inappropriate medication based on recommendations or guidelines | 6 (8.5) |
| C1.2- No drug indication | 0 (0) |
| C1.3- Inappropriate drug combinations, drug combinations with herbal remedies, or dietary supplements | 4 (5.7) |
| C1.4- Duplication of the active ingredient or therapeutic group that is not appropriate | 0 (0) |
| C1.5- No or incomplete drug treatment despite existing indication | 4 (5.7) |
| C1.6- Too many active ingredients and medications are prescribed for indications | 0 (0) |
| C2.1- Inappropriate medication formulation (for this patient) | 0 (0) |
| C3.1- Low Drug dose | 0 (0) |
| C3.2- High dose of a single active ingredient or drug | 8 (11.4) |
| C3.3- No frequent Dosage regimen | 4 (5.7) |
| C3.4- Too frequent Dosage regimen | 0 (0) |
| C3.5- Dose timing instructions wrong, unclear, or missing | 0 (0) |
| C4.1- Too short of a treatment period | 0 (0) |
| C4.2- Too long of a treatment duration | 18 (25.7) |
| C5.1- No availability of Prescribed drug | 0 (0) |
| C5.2- Necessary information not provided or incorrect advice provided | 0 (0) |
| C5.3- Incorrect medication, dosage, or strength | 0 (0) |
| C5.4- Dispensed Wrong drug or strength | 0 (0) |
| C6.1- Inappropriate dosing intervals or timing of administration by a health professional | 5 (7.1) |
| C6.2- Health professional administered Drug underly | 0 (0) |
| C6.3- Health professional administered Drug overly | 0 (0) |
| C6.4- Health professional not administered drug | 0 (0) |
| C6.5- Health professional administered Wrong drug | 0 (0) |
| C6.6- Health professional administered drug via wrong route | 0 (0) |
| C7.1- For whatever reason, the patient purposefully uses or takes less medication than is recommended or does not take it at all | 0 (0) |
| C7.2- The patient takes more medication than is prescribed | 0 (0) |
| C7.3- Drug abuse by the patient | 0 (0) |
| C7.4- The patient chooses to take an unnecessary medication | 0 (0) |
| C7.5- Drug-Food Interaction (Consumed by the patient) | 5 (7.1) |
| C7.6- Patient keeps the medication inappropriately | 0 (0) |
| C7.7- Inappropriate dosing intervals or timing | 0 (0) |
| C7.8- Patient unintentionally administers or utilizes the medication incorrectly | 1 (1.4) |
| C7.9- Patient physically unable to use drug/ form as directed | 0 (0) |
| C7.10- The patient is unable understand the directions | 5 (7.1) |
| C8.1- Problem with Medication reconciliation | 0 (0) |
| C9.1- Inadequate or improper outcome monitoring (including TDM) | 10 (14.2) |
| C9.2- Indication of additional Cause | 0 (0) |
| C9.3- Absence of Cause | 0 (0) |
| Intervention in Planning (n=70) | |
| I0- Absence of intervention | 0 (0) |
| I1.1- Intervention informed to prescriber only | 5 (7.1) |
| I1.2- Prescriber requested for the intervention details | 0 (0) |
| I1.3- Proposed intervention for the prescriber | 10 (14.2) |
| I1.4- Discussion of intervention with the physician | 36 (51.4) |
| I2.1- Patient counselling about the drugs | 0 (0) |
| I2.2- Provided Written information | 0 (0) |
| I2.3- Referred to the prescriber | 0 (0) |
| I2.4- Informed to caregiver or family member | 1 (1.4) |
| I3.1- Drug replaced to | 5 (7.1) |
| I3.2- Change of Dosage form | 0 (0) |
| I3.3- Modified Formulation | 0 (0) |
| I3.4- The usage guidelines were modified to | 4 (5.7) |
| I3.5- The drug stopped or paused | 2 (2.8) |
| I3.6- Another drug started | 0 (0) |
| I4.1- Additional intervention (specify) | 0 (0) |
| I4.2- Adverse events documented to authorities | 7 (10) |
| Acceptance of the Proposals for Intervention(n=70) | |
| A1.1- Acceptance and full implementation of the intervention | 40 (57.1) |
| A 1.2- Acceptance and partial implementation of the intervention | 19 (27.1) |
| A1.3- Intervention was accepted but not implemented | 7 (10) |
| A1.4- Accepted intervention, unclear implementation | 2 (2.8) |
| A2.1- Intervention is not feasible or accepted | 1 (1.4) |
| A2.2- Acceptance of intervention: no agreement | 1 (1.4) |
| A2.3- Reasons for rejecting the intervention (specify) | 0 (0) |
| A2.4- Unknown reason for not accepting the intervention | 0 (0) |
| A3.1- Intervention proposed but acceptance unclear | 0 (0) |
| A3.2- No proposal for intervention | 0 (0) |
| Outcome of Intervention (n=70) | |
| O0.1- Unknown Problem status | 2 (2.8) |
| O1.1- Problem solved totally | 36 (51.4) |
| O2.1- Problem solved partially | 17 (24.2) |
| O3.1- Insufficient cooperation from patient | 1 (1.4) |
| O3.2- Insufficient cooperation from prescribers | 1 (1.4) |
| O3.3- Ineffective intervention | 8 (11.4) |
| O3.4- No chance or necessity to solve problem | 5 (7.1) |
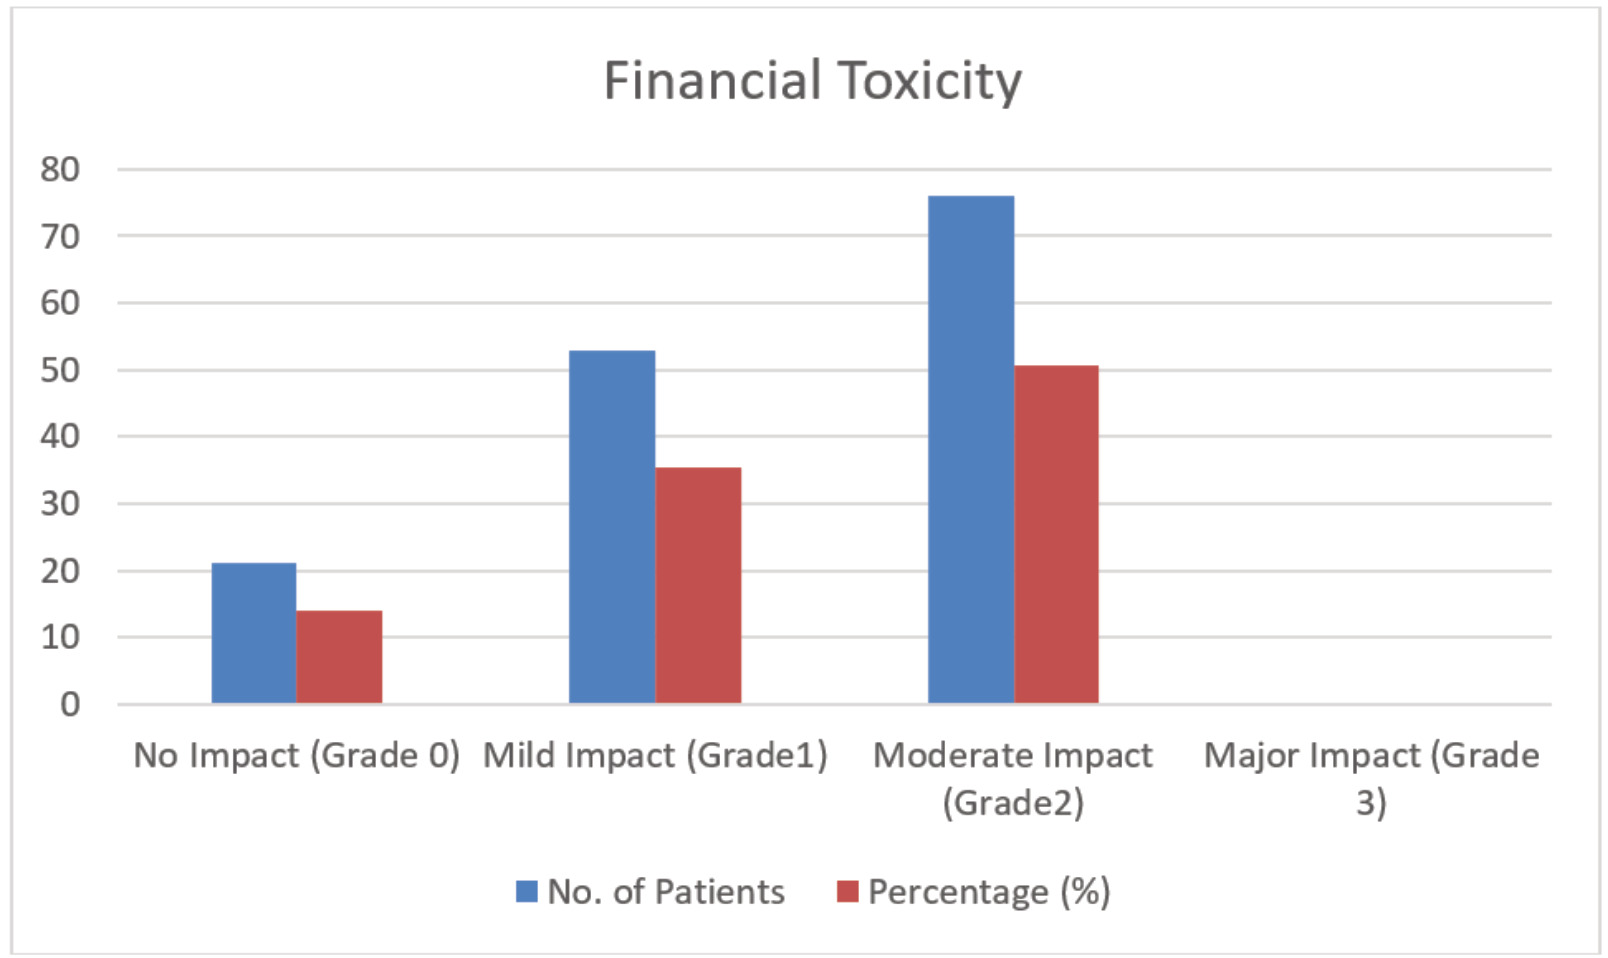
Figure 1
Impact Levels of Financial Toxicity observed in the Study Population.
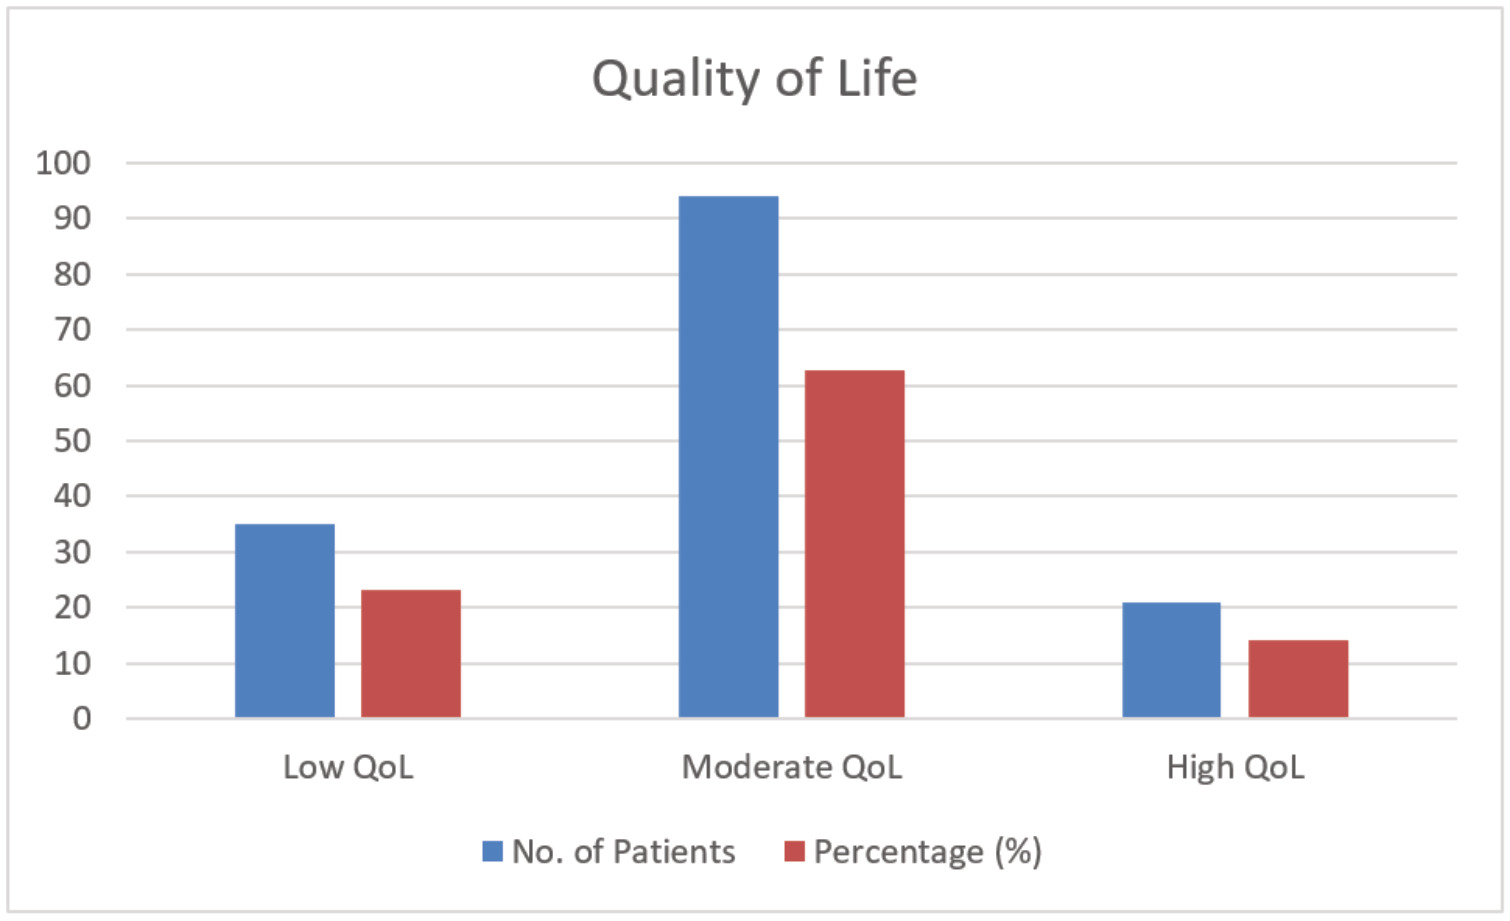
Figure 2
Levels of Quality of Life.
DISCUSSION
We demonstrated a correlation between high financial toxicity and a reduction in the quality-of-life of our population, which directly affects outcomes and compliance (Zafar et al., 2015). Our analysis showed a lower median COST score of 12, suggesting more severe financial impacts despite modifications in the research population and evaluation schedule, in comparison to the study of de Souza et al., which indicated that patients with advanced cancer had a median COST score of 23 (De Souza et al., 2017). When considering practical strategies to identify high risk patients for financial toxicity, it is important to understand the patient-related features associated with increased financial problems (Ezeife et al., 2019). Univariate analysis showed a significant relationship between changes in employment status, income level, and health insurance status and COST scores. On multivariable analysis, a significant predictor of financial toxicity was found to be lower household income. Patients earning between INR 1,25,000 and 5,00,000 also showed a significant correlation with financial toxicity (p=0.022), while those earning less than INR 1,25,000 had considerably lower COST scores, suggesting higher financial problems (p=0.006). Furthermore, there was an independent correlation (p=0.039) between a smaller home size (1-2 people) and higher financial toxicity. These results imply that the most vulnerable patients to financial damage from cancer are those with low incomes and little household support.
According to GLOBOCAN-2022 (Singh et al., 2025), gastrointestinal cancers ranked in top ten cancers (5th, 6th,7th ranks); which includes oesophagus cancer with incidence (5%) and mortality (7.2%), colorectum cancer with incidence (5%) and morality (4.5%), stomach cancer with incidence (46) and mortality (6.3) and cervical cancer ranked third with incidence
(9%) and mortality (8.7%). In our study, highly diagnosed cases were gastrointestinal cancers with 20% (including oesophageal, stomach or gastric, colorectal, liver or hepatocellular, and pancreatic), followed by others. According to the SECC (Socio-Economic and Caste Census), Andhra Pradesh state has 23.85% urban households, 27.20% were illiterate, and 57.88% were between primary and higher secondary.
Although a statistically significant difference in quality-of-life scores was observed between patients with and without DRPs, the findings suggest that these problems did not result in a clinically meaningful reduction in overall quality of life. This may be due to early detection and appropriate management of DRPs through routine clinical monitoring and pharmacist interventions. In addition, broader factors such as financial burden, disease severity, and social support may have had a greater influence on patient outcomes (Chino et al., 2020; Mathur et al., 2020).
Clinical oncology pharmacists play a major activity in minimizing the impact of drug-related-problems and financial toxicity in cancer care. They are actively involved in comprehensive medication therapy management, early identification and classification of DRPs using PCNE criteria, and optimization of the chemotherapy and a supportive care regimen. Pharmacists contribute to improving treatment safety through adverse drug reaction monitoring, drug-drug interaction screening, dose adjustment, and pharmacovigilance.
In addition, pharmacists provide patient counselling, adherence monitoring, and education on medication use, which helps prevent medication errors and enhances treatment outcomes. From a pharmacoeconomic perspective, pharmacists can support cost-effective therapy selection, promote generic substitution, rationalize polypharmacy, and guide patients toward financial assistance programs and insurance navigation. Their involvement in multidisciplinary oncology teams facilitates early intervention, reduces medication-related complications, and may indirectly improve quality of life despite the presence of DRPs. For this reason, including clinical pharmacists into cancer treatment is crucial to enhancing patient-centered outcomes, pharmaceutical safety, and financial burden management.
Table 4 Patient characteristics and the COST Outcome.
| Patient characteristics | Uni-variate analysis | Multi-variable analysis | |||
|---|---|---|---|---|---|
| Coefficient (95% CI) | p-Value | Coefficient (95% CI) | p-Value | ||
| Age (Yrs) | |||||
| <20 (Reference) | |||||
| 21 - 25 | 1.34 (-8.6 to 11.3) | 0.790 | -4.41 (-21.5 to 12.7) | 0.611 | |
| 26 - 30 | 3.77 (-4.0 to 11.5) | 0.339 | 2.28 (-6.9 to 11.5) | 0.627 | |
| 31 - 35 | -0.96 (-6.3 to 4.4) | 0.724 | -1.62 (-7.4 to 4.1) | 0.580 | |
| 36 - 40 | 1.43 (-5.2 to 8.0) | 0.670 | -0.44 (-7.2 to 6.4) | 0.899 | |
| 41 - 45 | 2.73 (-0.7 to 6.2) | 0.127 | 3.49 (-0.3 to 7.3) | 0.073 | |
| 46 - 50 | -2.88 (-6.4 to 0.6) | 0.112 | -3.53 (-7.4 to 0.3) | 0.078 | |
| >50 | -0.54 (-3.3 to 2.2) | 0.702 | -0.20 (-3.0 to 2.6) | 0.885 | |
| Gender | |||||
| Female (Reference) | |||||
| Male | 1.11 (-1.7 to 3.9) | 0.438 | 1.09 (-2.5 to 4.6) | 0.550 | |
| Marital Status | |||||
| Divorced/Separated/Widowed (Reference) | |||||
| Unmarried | 3.80 (-3.3 to 10.9) | 0.293 | 8.62 (-5.2 to 22.5) | 0.221 | |
| Married | 1.26 (-2.8 to 5.3) | 0.545 | 4.59 (-1.5 to 10.7) | 0.142 | |
| Widower | -2.05 (-12.0 to 7.9) | 0.685 | 1.44 (-10.2 to 13.1) | 0.807 | |
| Education Level | |||||
| Postgraduate and above (Reference) | |||||
| Graduate | 2.41 (-3.1 to 8.0) | 0.396 | -4.00(-28.9 to 20.9) | 0.751 | |
| Secondary level | -1.93 (-5.4 to 1.5) | 0.276 | -11.2 (-35.2 to 12.6) | 0.352 | |
| Primary level | 0.47 (-2.3 to 3.3) | 0.737 | -7.43 (-31.9 to 17.0) | 0.549 | |
| No Education | -0.25 (-3.3 to 2.8) | 0.874 | -6.72 (-31.3 to 17.9) | 0.590 | |
| Occupation | |||||
| Labour work (Reference) | |||||
| Unemployed | 2.46 (-3.4 to 8.3) | 0.409 | -0.67 (-7.7 to 6.4) | 0.850 | |
| Employed | 0.86 (-2.2 to 4.0) | 0.587 | 0.38 (-4.5 to 5.3) | 0.879 | |
| Homemaker | -0.77 (-3.9 to 2.3) | 0.625 | -0.44 (-4.8 to 3.9) | 0.841 | |
| Farmer | -0.81 (-5.0 to 3.3) | 0.701 | -2.48 (-8.0 to 3.0) | 0.375 | |
| Business | -1.66 (-7.5 to 4.2) | 0.577 | -3.17 (-10.2 to 3.9) | 0.376 | |
| Household Size | |||||
| >6 Persons (Reference) | |||||
| 4-6 Persons | -2.18 (-5.7 to 1.3) | 0.224 | -2.62 (-10.3 to 5.1) | 0.503 | |
| 2-4 Persons | 2.00 (-1.0 to 5.0) | 0.192 | 3.85 (-3.3 to 11.0) | 0.290 | |
| 1-2 Persons | -0.05 (-5.6 to 5.5) | 0.986 | 9.50 (0.4 to 18.5) | 0.039 | |
| Health Insurance | |||||
| No (Reference) | |||||
| Yes | 4.08 (1.3 to 6.8) | 0.004 | 1.40 (-0.5 to 5.6) | 0.109 | |
| Income as per INR | |||||
| > 3 million (Reference) | |||||
| 5,00,000-3 million | 3.76 (-2.1 to 9.6) | 0.207 | 11.2 (3.6 to 18.9) | 0.095 | |
| Coefficient (95% CI) | p-Value | Coefficient (95% CI) | p-Value | ||
| 1,25,000-5,00,000 | 2.05 (-0.7 to 4.8) | 0.156 | 4.07 (0.5 to 7.5) | 0.022 | |
| <1,25,000 | -3.13 (-6.0 to -0.2) | 0.035 | -9.44 (-16.2 to -2.6) | 0.006 | |
| Current Employment Changes | |||||
| Increased working hours (Reference) | |||||
| Reduction in working hours | 1.63 (-1.3 to 4.6) | 0.279 | -0.12 (-9.2 to 8.9) | 0.978 | |
| Stopped Working | 2.36 (-1.6 to 6.3) | 0.247 | 1.92 (-8.1 to 11.9) | 0.706 | |
| No change in work | -4.37 (-8.0 to -0.7) | 0.018 | -6.36 (-15.6 to 2.9) | 0.179 | |
| Current Employment Changes | |||||
| Increased working hours (Reference) | |||||
| Reduction in working hours | 1.63 (-1.3 to 4.6) | 0.279 | -0.12 (-9.2 to 8.9) | 0.978 | |
| Stopped Working | 2.36 (-1.6 to 6.3) | 0.247 | 1.92 (-8.1 to 11.9) | 0.706 | |
| No change in work | -4.37 (-8.0 to -0.7) | 0.018 | -6.36 (-15.6 to 2.9) | 0.179 | |
| ECOG | |||||
| 0 (Reference) | |||||
| 1 | -1.31 (-5.2 to 2.6) | 0.513 | 0.18 (-4.7 to 5.0) | 0.942 | |
| ≥2 | 2.13 (-0.8 to 5.1) | 0.160 | 2.13 (-1.5 to 5.8) | 0.260 | |
CONCLUSION
According to this study, financial toxicity is weakly correlated to a lower quality of life for cancer patients, and low income is a powerful independent predictor of more financial distress. Despite the presence of drug-related problems, no clinically meaningful decline in overall quality of life was observed, even though statistical differences were identified between groups.
Our findings emphasize the need of routine financial toxicity screening and the integration of clinical oncology pharmacists in multidisciplinary care to enhance pharmaceutical therapy, identify and resolve DRPs, and promote cost-effective, patient-centered cancer management.
LIMITATIONS AND FUTURE RECOMMENDATIONS
This Prospective Observational study has certain limitations, including its inability to establish causal relationships. Additionally, its single-center design may limit generalizability, and the use of self-reported questionnaires could have introduced recall or response bias.
Future research should evaluate the underlying causes of drug-related problems, financial toxicity, and quality of life using multicentric and longitudinal studies. Larger sample sizes and the inclusion of other clinical and psychological aspects are also advised. Regular financial toxicity assessment needs to be a part of cancer treatment in clinical settings. Pharmacists should assume greater responsibilities within multidisciplinary oncology teams to enhance patient-centered cancer care. Drug management, patient education, and the reduction of financial burden will all benefit from this.
SUMMARY
This prospective observational study evaluated financial toxicity, Drug-Related Problems (DRPs), and Quality of Life (QoL) among 150 cancer patients in India using the COST-FACIT, FACT-G, and Pharmaceutical Care Network Europe (PCNE) classification. Financial toxicity was observed in 86% of the study population, indicating a substantial financial burden among cancer patients. A weak negative correlation was observed between financial toxicity and quality of life (r=-0.16). Drug-related problems were identified in 46.6% of patients; however, DRPs did not independently predict lower quality of life in this population. Multivariable analysis identified low income and small household size as significant independent predictors of higher financial toxicity. These findings highlight the importance of routinely assessing financial toxicity and medication-related problems as part of comprehensive cancer care. Early identification of financial difficulties and DRPs, together with appropriate clinical pharmacy interventions and supportive measures, may help address the broader socioeconomic and therapeutic challenges experienced by cancer patients.
Table S1 Assessment of cost-coping strategies for patients who are having a financial burden (n=129).
| Type of strategy | Frequency (%) |
|---|---|
| Delay the start of cancer treatment | 3 (2.3) |
| Skipped follow-up treatment | 8 (6.2) |
| Decreased spending on basics like food, clothes, furniture, etc., | 21 (16.2) |
| Decreased spending on leisure activities | 4 (3.1) |
| Used savings to pay for cancer care in hospital | 10 (7.7) |
| Sold financial assets | 13 (10) |
| Borrowed money at interest | 40 (31) |
| Borrowed money from social networks (relatives and friends) | 25 (19.3) |
| Asked your doctor for a less expensive treatment | 5 (3.8) |
| Refused recommended test because of cost | 0 (0) |
| Applied for financial assistance | 0 (0) |
Abbreviations
CI: Confidence Interval
COST: Comprehensive Score for Financial Toxicity
DRPs: Drug-Related Problems
ECOG: Eastern Cooperative Oncology Group
FACT-G: Functional Assessment of Cancer Therapy-General
HRQoL: Health-Related Quality of Life
INR: Indian Rupees
LMICs: Low-and Middle-Income Countries
PCNE: Pharmaceutical Care Network Europe
QoL: Quality of Life
SD: Standard Deviation
SPSS: Statistical Package for the Social Sciences
TDM: Therapeutic Drug Monitoring
VIF: Variance Inflation Factors
WHO: World Health Organization.
Acknowledgments
We want to sincerely thank everyone who helped us with this work. Special thanks to Dr. Shaik Faizan Ali (Head of Department) for their invaluable guidance and encouragement. We are also grateful to Nirmala College of Pharmacy, Atmakuru, Mangalagiri, Guntur, India, for providing the resources and environment that made this work possible. Finally, we thank our families and friends for their continual support and motivation.
Author Contributions
Vemula Jyothi: Study conception, data collection, data analysis, interpretation of results, and manuscript preparation. Sudarsanam Mounika: Data collection and manuscript review. Kethireddy Pradeep: Data analysis and interpretation. Kolapalli Prasanthi: Manuscript review and editing. Dr. Shaik Faizan Ali: Supervision, critical review, and final approval of the manuscript.
Conflict of Interest
The authors declare that there is no conflict of interest.
References
Ahmed, K. O., Muddather, H. F., Yousef, B. A.. (2021). Pharmaceutical Care Network Europe (PCNE) drug-related problems classification version 9.1: First implementation in Sudan. Journal of Pharmaceutical Research International, 33(59A), 699-706. https://doi.org/10.9734/jpri/2021/v33i59A34321
Cella, D. F., Bonomi, A. E., Lloyd, S. R., Tulsky, D. S., Kaplan, E., Bonomi, P.. (1995). Reliability and validity of the Functional Assessment of Cancer Therapy-Lung (FACT-L) quality of life instrument. Lung Cancer, 12(3), 199-220. https://doi.org/10.1016/0169-5002(95)00450-F
Chen, S., Cao, Z., Prettner, K., Kuhn, M., Yang, J., Jiao, L., et al.. (2023). Estimates and projections of the global economic cost of 29 cancers in 204 countries and territories from 2020 to 2050. JAMA Oncology, 9(4), 465-472. https://doi.org/10.1001/jamaoncol.2022.7826
Chino, F., et al.. (2020). Financial toxicity and quality of life in cancer patients. JCO Oncology Practice. https://doi.org/10.1200/OP.21.00727
De Souza, J. A., Yap, B. J., Hlubocky, F. J., Wroblewski, K., Ratain, M. J., Cella, D., Daugherty, C. K.. (2014). The development of a financial toxicity patient-reported outcome in cancer: The COST measure. Cancer, 120(20), 3245-3253. https://doi.org/10.1002/cncr.28814
De Souza, J. A., Yap, B. J., Wroblewski, K., Blinder, V., Araújo, F. S., et al.. (2017). Measuring financial toxicity as a clinically relevant patient-reported outcome: The validation of the COmprehensive Score for financial Toxicity (COST). Cancer, 123(3), 476-484. https://doi.org/10.1002/cncr.30369
Ezeife, D. A., Morganstein, B. J., Lau, S., Law, J. H., Le, L. W., et al.. (2019). Financial burden among patients with lung cancer in a publicly funded health care system. Clinical Lung Cancer, 20(4), 231-236. https://doi.org/10.1016/j.cllc.2018.12.010
Gordon, L. G., Walker, S. M., Mervin, M. C., Lowe, A., Smith, D. P., et al.. (2017). Financial toxicity: A potential side effect of prostate cancer treatment among Australian men. European Journal of Cancer Care, 26(1), e12392. https://doi.org/10.1111/ecc.12392
Joshi, A., Kalra, D., Menon, N., Gadgil, D., Pashilkar, S., Mokal, S., Prabhash, K., Noronha, V.. (2022). Translation and validation of COST-FACIT (version 2) questionnaire into Hindi and Marathi to assess financial toxicity in Indian cancer patients. South Asian Journal of Cancer, 11(2), 97-104. https://doi.org/10.1055/s-0041-1741074
Kitaw, T. A., Tilahun, B. D., Zemariam, A. B., Getie, A., Bizuayehu, M. A., Haile, R. N.. (2025). The financial toxicity of cancer: Unveiling global burden and risk factors-A systematic review and meta-analysis. BMJ Global Health, 10(2), e017133. https://doi.org/10.1136/bmjgh-2024-017133
Lin, K., Kagalwalla, S., Gupta, A.. (2025). Characterizing and addressing the financial, time, and administrative burdens of cancer and its care. Current Treatment Options in Oncology, 26(12), 1078-1085. https://doi.org/10.1007/s11864-025-01358-w
Mathur, P., Sathishkumar, K., Chaturvedi, M., Das, P., Sudarshan, K. L., et al.. (2020). Cancer statistics, 2020: Report from national cancer registry programme, India. JCO Global Oncology, 6, 1063-1075. https://doi.org/10.1200/GO.20.00122
Osoro, I., Jawahar, S., Murugan, A., Muthukumaran, H., Shanmuganathan, S., Rajanandh, M. G.. (2026). Drug-related problems in pediatric, adult and geriatric cancer patients: A systematic review. Cancer Treatment and Research Communications, 101093. https://doi.org/10.1016/j.ctarc.2026.101093
Overcash, J., Extermann, M., Parr, J., Perry, J., Balducci, L.. (2001). Validity and reliability of the FACT-G scale for use in the older person with cancer. American Journal of Clinical Oncology, 24(6), 591-596. https://doi.org/10.1097/00000421-200112000-00013
Parás-Bravo, P., Salvadores-Fuentes, P., Alonso-Blanco, C., et al.. (2017). The impact of muscle relaxation techniques on the quality of life of cancer patients, as measured by the FACT-G questionnaire. PLOS ONE, 12(10), e0184147. https://doi.org/10.1371/journal.pone.0184147
Singh, K., Grover, A., Dssshanasekaran, K.. (2025). Unveiling the cancer epidemic in India: A glimpse into GLOBOCAN 2022 and past patterns. The Lancet Regional Health-Southeast Asia, 34, 100546. https://doi.org/10.1016/j.lansea.2025.100546
Sideris, L., Karampli, E., Athanasakis, K.. (2025). Research on the issue of financial toxicity in cancer: A systematic review of the literature. Journal of Cancer Policy, 100581. https://doi.org/10.1016/j.jcpo.2025.100581
Sok, M., Zavrl, M., Greif, B., Srpčič, M.. (2019). Objective assessment of WHO/ECOG performance status. Supportive Care in Cancer, 27(10), 3793-3798. https://doi.org/10.1007/s00520-018-4597-z
Smith, G. L., Lopez-Olivo, M. A., Advani, P. G., Ning, M. S., et al.. (2019). Financial burdens of cancer treatment: A systematic review of risk factors and outcomes. Journal of the National Comprehensive Cancer Network, 17(10), 1184-1192. https://doi.org/10.6004/jnccn.2019.7305
Tran, G., Zafar, S. Y.. (2018). Financial toxicity and implications for cancer care in the era of molecular and immune therapies. Annals of Translational Medicine, 6(9), 166. https://doi.org/10.21037/atm.2018.03.28
Zafar, S. Y., McNeil, R. B., Thomas, C. M., Lathan, C. S., Ayanian, J. Z., Provenzale, D.. (2015). Population-based assessment of cancer survivors' financial burden and quality of life: A prospective cohort study. Journal of Oncology Practice, 11(2), 145-150. https://doi.org/10.1200/JOP.2014.001542